Note
Go to the end to download the full example code.
Optical Photometry
This example demonstrates how to model galaxy photometric magnitudes using the kcorrect spectral energy distribution templates as implemented in SkyPy.
kcorrect Spectral Templates
In SkyPy, the rest-frame spectral energy distributions (SEDs) of galaxies can
be modelled as a linear combination of the five kcorrect basis templates
[1]. One possible model for the coefficients is a redshift-dependent
Dirichlet distribution [2] which can be sampled from using the
dirichlet_coefficients
function. The coefficients are then taken by the kcorrect.absolute_magnitudes and
kcorrect.apparent_magnitudes
methods to calculate the relevant photometric quantities using the
speclite package. Note that since the kcorrect
templates are defined per unit stellar mass, the total stellar mass of each
galaxy must either be given or calculated from its absolute magnitude in
another band using kcorrect.stellar_mass.
An example simulation for the SDSS u- and r-band apparent magnitudes of “red”
and “blue” galaxy populations is given by the following config file:
cosmology: !astropy.cosmology.default_cosmology.get []
z_range: !numpy.linspace [0, 2, 21]
M_star: !astropy.modeling.models.Linear1D [-0.9408582, -20.40492365]
phi_star: !astropy.modeling.models.Exponential1D [0.00370253, -9.73858]
M_star_red: !astropy.modeling.models.Linear1D [-0.70798041, -20.37196157]
phi_star_red: !astropy.modeling.models.Exponential1D [0.0035097, -1.41649]
magnitude_limit: 23
sky_area: 10 deg2
tables:
  blue_galaxies:
    redshift, magnitude: !skypy.galaxies.schechter_lf
      redshift: $z_range
      M_star: $M_star
      phi_star: $phi_star
      alpha: -1.3
      m_lim: $magnitude_limit
      sky_area: $sky_area
    spectral_coefficients: !skypy.galaxies.spectrum.dirichlet_coefficients
      alpha0: [2.079, 3.524, 1.917, 1.992, 2.536]
      alpha1: [2.265, 3.862, 1.921, 1.685, 2.480]
      weight: [3.47e+09, 3.31e+06, 2.13e+09, 1.64e+10, 1.01e+09]
      redshift: $blue_galaxies.redshift
    stellar_mass: !skypy.galaxies.spectrum.kcorrect.stellar_mass
      coefficients: $blue_galaxies.spectral_coefficients
      magnitudes: $blue_galaxies.magnitude
      filter: bessell-B
    mag_u, mag_g, mag_r, mag_i, mag_z: !skypy.galaxies.spectrum.kcorrect.apparent_magnitudes
      coefficients: $blue_galaxies.spectral_coefficients
      redshift: $blue_galaxies.redshift
      filters: sdss2010-*
      stellar_mass: $blue_galaxies.stellar_mass
  red_galaxies:
    redshift, magnitude: !skypy.galaxies.schechter_lf
      redshift: $z_range
      M_star: $M_star_red
      phi_star: $phi_star_red
      alpha: -0.5
      m_lim: $magnitude_limit
      sky_area: $sky_area
    spectral_coefficients: !skypy.galaxies.spectrum.dirichlet_coefficients
      alpha0: [2.461, 2.358, 2.568, 2.268, 2.402]
      alpha1: [2.410, 2.340, 2.200, 2.540, 2.464]
      weight: [3.84e+09, 1.57e+06, 3.91e+08, 4.66e+10, 3.03e+07]
      redshift: $red_galaxies.redshift
    stellar_mass: !skypy.galaxies.spectrum.kcorrect.stellar_mass
      coefficients: $red_galaxies.spectral_coefficients
      magnitudes: $red_galaxies.magnitude
      filter: bessell-B
    mag_u, mag_g, mag_r, mag_i, mag_z: !skypy.galaxies.spectrum.kcorrect.apparent_magnitudes
      coefficients: $red_galaxies.spectral_coefficients
      redshift: $red_galaxies.redshift
      filters: sdss2010-*
      stellar_mass: $red_galaxies.stellar_mass
The config file can be downloaded
here
and the simulation can be run either from the command line and saved to FITS
files:
$ skypy examples/galaxies/sdss_photometry.yml sdss_photometry.fits
or in a python script using the Pipeline
class as demonstrated in the SDSS Photometry section below. For more
details on writing config files see the Pipeline Documentation.
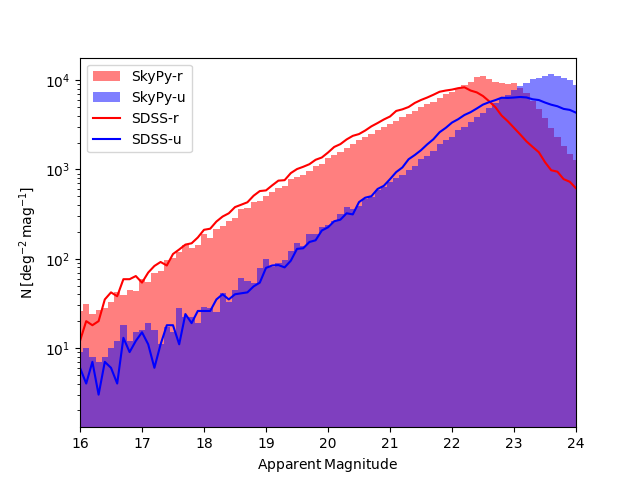
SDSS Photometry
Here we compare the apparent magnitude distributions of our simulated
galaxies with data from a \(10 \, \mathrm{deg^2}\) region of the Sloan
Digital Sky Survey [3]. The binned SDSS magnitude distributions were
generated from a query of the DR7 data release and can be downloaded
here.
from astropy.table import Table, vstack
from matplotlib import pyplot as plt
import numpy as np
from skypy.pipeline import Pipeline

# Execute SkyPy galaxy photometry simulation pipeline
pipeline = Pipeline.read("sdss_photometry.yml")
pipeline.execute()
skypy_galaxies = vstack([pipeline['blue_galaxies'], pipeline['red_galaxies']])

# SDSS magnitude distributions for a 10 degree^2 region
sdss_data = Table.read("sdss_dered_10deg2.ecsv", format='ascii.ecsv')

# Plot magnitude distributions for SkyPy simulation and SDSS data
bins = np.linspace(14.95, 25.05, 102)
plt.hist(skypy_galaxies['mag_r'], bins=bins, alpha=0.5, color='r', label='SkyPy-r')
plt.hist(skypy_galaxies['mag_u'], bins=bins, alpha=0.5, color='b', label='SkyPy-u')
plt.plot(sdss_data['magnitude'], sdss_data['dered_r'], color='r', label='SDSS-r')
plt.plot(sdss_data['magnitude'], sdss_data['dered_u'], color='b', label='SDSS-u')
plt.xlim(16, 24)
plt.yscale('log')
plt.xlabel(r'$\mathrm{Apparent\,Magnitude}$')
plt.ylabel(r'$\mathrm{N} \, [\mathrm{deg}^{-2} \, \mathrm{mag}^{-1}]$')
plt.legend()
plt.show()
References
Total running time of the script: (0 minutes 17.968 seconds)